Ola Ahlqvist on Dance and Geography
 NORAH: Ola, let’s start with a discussion of your involvement in the project. I’ve had a long term interest in geography because of my previous work in environmental science but for many people the connection between dance and geography might seem surprising.
OLA: For me too, in fact my biggest surprise was how familiar I felt with some of the things that choreography and this particular dance contain. A lot of analysis and visualization work we have done has used ideas from geographical analysis and spatial theory, and it was exciting to see that they were interesting to you as ways to look at and understand this dance. What intrigues me most at this point is how much similarity there is between choreography and daily life as a spatial phenomenon (which is what we study a lot as geographers). The spatial dynamics and interactions are guided by the environment, there are some rules, but also a fair amount of improvisation in both “worlds”.
In terms of how these collaborations come about, my way into the project was mainly as advisor to a doctoral student, Hyowon Ban who got to know you all through an animation course at ACCAD. I could see a way in to working together because you had generated data from the choreographic structures in the dance. That data is spatial (something of interest to geographers) and also qualitative in that you know what the dancers are doing. The equivalent in geography would be having GPS data (tracking where someone goes) combined with GIS data (telling you who they are and something about what they are doing).
Let me say this another way, the data you created from the dance (One Flat Thing, reproduced) is in many ways similar to what we would expect from looking at individual activity patterns in a real-world situation, but that type of data is still very hard to acquire. Because we have such a rich and contained data set I believe we can use this as a model for the real world or as a surrogate for many types of questions and method development. We’re just starting this research so the specifics aren’t clear but the potential is. Some of the things I’d like to see in further looking into this data is to include the narrative descriptions from dancers or other people involved in this project. As geographers we often try to mix quantitative methods, such as the spatial data we use in the Movement Density object, with qualitative analyses from interviews and texts. Again I think that this data give us a good opportunity to come to grips with some of the complexities of such analyses. It is almost as if we have a controlled environment for qualitative inquiry, similar to what the ‘hard science’ tradition has capitalized on for more quantitative hypothesis evaluations.
NORAH: How do you think the research we’re doing in Synchronous Objects is relevant to geography specifically?
OLA: I see it mainly as a channel for communicating the idea of using geographic theory in another context. After working on this project I now realize that there is much more depth and things going on in a dance than I ever imagined. This could impact other geographers as well. I am learning new things each time I sit down with the other people in this project and hopefully that experience will be the same when people see the website. And for me it was the use of space and dynamic, spatial interaction between actors that struck a chord, but others may find completely different dimensions, and that’s what is so exciting.
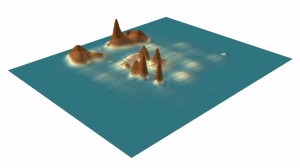
Also, the ideas that currently emerge are intriguing directions of research from a geographic perspective. We have identified some new research ideas that probably will generate publishable results both as stand-alone geographic research and probably also as cross-disciplinary contributions to the literature. The Movement Density object we use a spatial summary statistic called density surface that is a common tool in geographic visualization. In this case, it helps us explore patterns of where the dancers spend most of their time. As we follow the dance we can see how certain areas are used more than others by the dancers. After a while, hot-spots, or places that were most used by the dancers, show up as intense, brown-red and places with little activity remain in blue shades. The density surface can also be illustrated as a topographic landscape where the count of points is used as an elevation value, creating a landscape of mountains, peaks, and valleys. In the topographic map the hot-spots, are found as mountain tops or ridges, and the deep valleys and flatlands represent little or no dancer activity. You can see all this in our explanatory video on the Movement Density object and I talk about it there too. Because we have such a contained data set we can really use this as a model for the real world.
Another direct outcome of this research is that my student Hyowon completed her dissertation using her work on this project and it helped her get a job as a faculty member at another university. I’m excited to see what else emerges as we continue to collaborate.
–Ola Ahlqvist, assistant professor, Department of Geography


Recent Comments